

| Public Higher Education System | Research Expenditures (in thousands) |
| University of California System | $5,637,475 |
| University of Texas System | $2,857,255 |
| State University System of Florida | $1,980,413 |
| University System of Ohio | $1,621,935 |
| University of North Carolina System | $1,596,133 |
| University of Michigan (Ann Arbor + Dearborn) | $1,377,080 |
| University System of Georgia | $1,377,004 |
| University of Washington (all campuses) | $1,191,838 |
| University of Wisconsin System | $1,145,164 |
| Indiana University/Purdue University Systems | $1,119,103 |
| University System of Maryland | $999,414 |
| University of Illinois System | $996,447 |
| Texas A&M System | $946,212 |
| SUNY (State University of New York) | $889,461 |
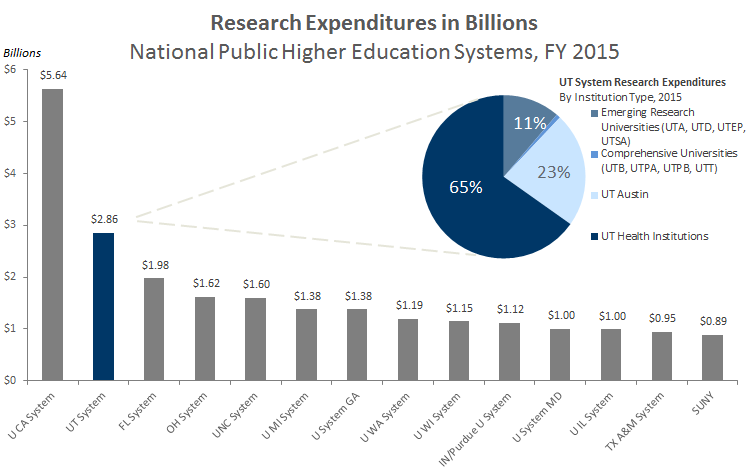
Despite fierce competition for research dollars, UT System institutions procure an impressive level of funding for research. In FY 2015, UT System topped $2.8 billion in research and development (R&D) expenditures. Nearly a quarter of these expenditures can be attributed to the flagship institution, UT Austin, while UT health institutions account for another almost two-thirds of expenditures.
UT System ranks second in the nation in R&D expenditures among public university systems. The University of California System is number one nationally ($5.6 billion). However, UT System’s growth in research expenditures outpaced the UC System from FY 2009 to FY 2015—18% compared to 12%.
Growth in research and development expenditures is one indication that The University of Texas System is constantly working to fulfill an important piece of its mission—to engage in high-quality, innovative research that brings about the discovery, dissemination and application of knowledge.
There are many examples of the impact that UT System’s R&D expenditures have had on a state, national, and global scale. Increasing expenditure levels at UT MD Anderson Cancer Center (UTMDA) have helped it to achieve and maintain its status as one of the top cancer centers in the world. UTMDA is responsible for more than one-third of all new FDA-approved cancer drugs and conducts more cancer trials than any institution in the world. Expenditures at UT Medical Branch enabled them to take a leading role in developing treatments and vaccines for global infectious diseases, including Ebola, through their Galveston National Laboratory—the only operational BioSafety Level 4 national lab on a university campus in the United States. The UT System is also the only university system in the nation to have received four Clinical and Translational Science Awards from the National Institutes of Health for proven success in quickly bringing the drugs and therapies that are discovered to patients.
The world-class research conducted at UT System institutions leads to products and processes that have significant impacts on the health, economy, and culture of our interconnected world.
About the Data
Expenditures rather than awards are presented because expenditures more accurately reflect the level of current research activity. Expenditures include funding from federal, state/local government, institution, business, nonprofit organization, and other sources.
The National Science Foundation’s (NSF) Higher Education Research and Development (HERD) Survey is the primary national source of information on R&D expenditures within higher education institutions in the U.S. and outlying areas. The survey is an annual census of institutions that expended at least $150,000 in separately budgeted R&D in the fiscal year. These data are used when reviewing UT System performance in the context of institutions across the United States, which is what is displayed in the bar graphs and tables above.
Data can also be used from the Texas Higher Education Coordinating Board (THECB) if only institutions from within Texas are presented. R&D expenditure data from the THECB are typically more current than the national NSF data—the NSF national data can lag behind by one or more years in comparison to the THECB. Differences between the NSF and THECB R&D figures can be attributed to the following:
- The NSF survey allows institutions to calculate their unreimbursed indirect costs. THECB’s survey allows only tracked indirect costs as reported in the institution’s annual financial report. Institutions using the NSF calculation will have a considerably higher total in the “Institution” source of funding in NSF reports by comparison with THECB reports.
- NSF may impute data for institutions that do not respond to or fully complete their survey.
Sources
Texas Higher Education Coordinating Board, Research Expenditures.