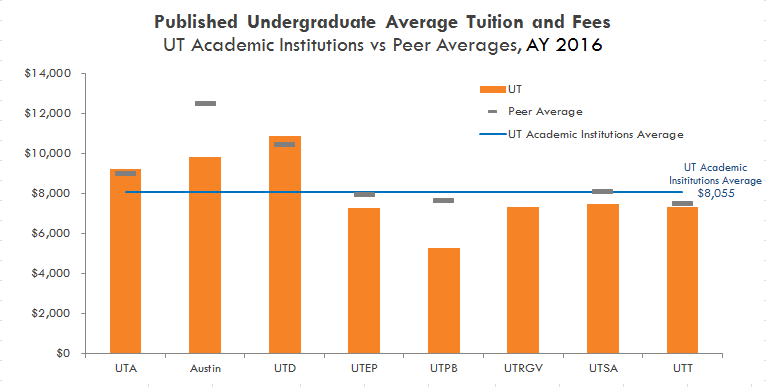
Note: The UT Brownsville and UT Pan American campuses closed at the end of AY 2015.
UT Rio Grande Valley began enrolling students in Fall 2015 and its peer institutions have not yet been established.
| Institution | AY 2012 | AY 2016 | Peer Average, AY 2016 |
| UTA | $8,878 | $9,208 | $9,001 |
| UT Austin | $9,794 | $9,806 | $12,484 |
| UTD | $10,276 | $10,864 | $10,408 |
| UTEP | $7,065 | $7,259 | $7,944 |
| UTPB | $5,124 | $5,250 | $7,644 |
| UTRGV | $7,292 | ||
| UTSA | $7,042 | $7,447 | $8,104 |
| UTT | $5,124 | $7,312 | $7,476 |
| UT Academic Institution Average | $7,077 | $8,055 |
Notes: The UT Brownsville and UT Pan American campuses closed at the end of AY 2015, therefore the tuition and fees for these institutions is included in the AY 2012 UT Academic Institution average, but not the AY 2016 average. UT Rio Grande Valley began enrolling students in Fall 2015 and therefore is included only in the AY 2016 UT Academic Institution average.
UT System institutions are working to keep college affordable. For academic year 2016, the average in-state tuition for first-time, full-time undergraduates at UT System academic institutions is $8,055. This is below the national average across public four-year institutions, which is $8,141. Further, five of seven UT System academic institutions had an average in-state tuition below that of their peers (note that UTRGV does not yet have peer institutions established).
Keeping college affordable is critical for maintaining access to Texas residents and to developing an educated workforce prepared for the future. UT System's mission statement makes its commitment to providing "superior, accessible, affordable instruction" clear.(1) Among 25 peer public university systems across the country, UT System academic institutions had the third lowest dollar increase in tuition and fees since AY 2012. Though minimizing increases in tuition and fees is crucial, it is also important that grant and scholarship aid keep pace with the rising cost of attendance to ensure access and affordability. In AY 2015, grant and scholarship aid to UT System undergraduates covered, on average, 39% of students’ full cost of attendance, compared to the national average of 36% for public four-year institutions in AY 2014. Despite its higher performance versus the national average, UT System’s AY 2015 levels reflect a decrease from its status in AY 2011 (43%). However, it is important to note that this could be due, at least in part, to the recommendation by the TEXAS Grant program that average award amounts be reduced beginning in AY 2012.
About the Data Tuition and Fee data are the average in-state tuition and fee amounts for the full academic year for full-time, first-time degree/certificate-seeking undergraduates as reported to the U.S. Department of Education's Integrated Postsecondary Education Data System (IPEDS). Peer comparisons are based on each UT institution's peers as determined by an extensive peer-setting process in 2012.
Sources U.S. Department of Education, National Center for Education Statistics, Integrated Postsecondary Education Data System (IPEDS); Texas Higher Education Coordinating Board student data, and Financial Aid Data System (FADS).
Notes (1) UT System Mission Statement

