

$5,354 per Full-Time Equivalent (FTE) Student in State Appropriations
$7,555 per Full-Time Equivalent (FTE) Student from Tuition and Fee Revenue
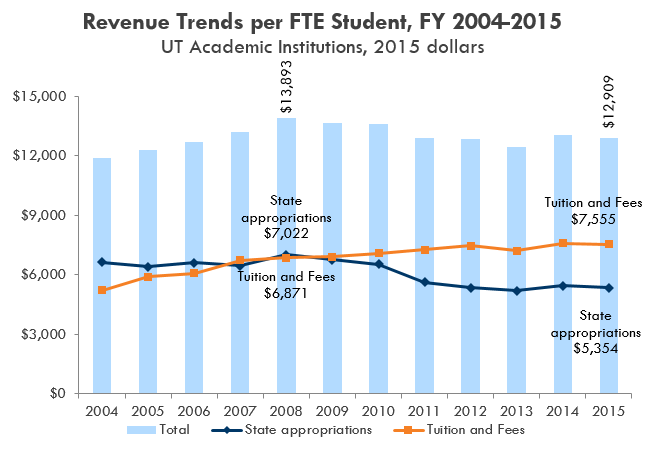
| Fiscal Year | Tuition & Fees per FTE | State Appropriations per FTE | Total, Tuition & Fees and State Appropriations per FTE |
| 2004 | $5,231 | $6,643 | $11,874 |
| 2005 | $5,910 | $6,413 | $12,323 |
| 2006 | $6,088 | $6,622 | $12,710 |
| 2007 | $6,732 | $6,454 | $13,186 |
| 2008 | $6,871 | $7,022 | $13,893 |
| 2009 | $6,928 | $6,756 | $13,684 |
| 2010 | $7,092 | $6,539 | $13,631 |
| 2011 | $7,273 | $5,623 | $12,896 |
| 2012 | $7,481 | $5,369 | $12,850 |
| 2013 | $7,227 | $5,208 | $12,435 |
| 2014 | $7,602 | $5,461 | $13,063 |
| 2015 | $7,555 | $5,354 | $12,909 |
Revenues from tuition and fees have risen as support from state appropriations have declined.
State funding is declining. Over the last five years alone, state appropriations have declined by $1,185 for UT System academic institutions.
In FY 2004, state appropriations exceeded tuition and fee revenue by almost $1,400 per student for UT System academic institutions. In FY 2015, the opposite was true—tuition and fee revenue exceeded state appropriations by more than $2,200 per student. Since FY 2008, each individual UT System academic institution experienced a sharp decline in state appropriations.
Over the past decade, declines in state appropriations at UT System institutions have resulted in the need for UT System, its Board of Regents, and its institutions to cut costs and find alternate revenue streams. In earlier years, state appropriations accounted for a greater proportion of funding per student than tuition and fees (as high as 56% in FY 2004). But, since 2009, tuition and fee revenue has surpassed state appropriations per student (accounting for as much as 59% in FY 2015).
Diminishing state support is a challenge that is not unique to UT System or even Texas. The majority of states across the nation struggle with the same issues—maintaining affordability and quality while experiencing cuts in state funding. Despite these decreases in state funding, the UT System is dedicated to maintaining the affordability of its institutions. This is evidenced by the minimal increases in tuition and fees over the last several years. (1)
About the Data
Per student = per full-time equivalent (FTE) student.
Adjusted for inflation to FY 2015 dollars using the Consumer Price Index – Urban for September.
Tuition and fee revenue is net of scholarship and fellowship discounts and waivers. State Appropriations include general revenue support from the State of Texas for instruction and operations, infrastructure support, special items, tuition revenue bond debt service, and group health insurance and employee benefits. Totals do not include the University of Texas at Brownsville.
Sources
FY 2004 - FY 2015 Annual Financial Reports (AFR), Office of the Controller.